.svg)
.svg)
.svg)
.svg)
.svg)


.svg)


.svg)
.svg)

Product managers, designers, developers —everyone knows how crucial it is to understand what’s working in a product and what’s not. However, pinpointing these factors can be incredibly challenging.
If you don't monitor certain user events and metrics, you'll probably wonder why users abandon certain features or fail to engage with others. This can lead to lost revenue, diminished customer loyalty, and missed opportunities for growth.
This is where product adoption metrics come in.
They reveal how users interact with your product, highlighting what works and what doesn’t. However, finding the right metrics can be as tough as understanding user behavior.
And that's what we'll talk about.
So, let's get on with it 🤸🏻♀️
TL;DR
- Product adoption metrics allow you to examine your UX more closely and thus improve it. You can see when, how often, and how your users interact with your product.
- You miss out on potential growth opportunities when you do not track and monitor product adoption metrics. You also lose sight of customer needs and preferences.
- Depending on your product, user base, and goals, you need to choose the most suitable ones and monitor only those metrics.
- Monitoring unnecessary metrics might put you under too much stress and put you under a heavy workload. And not monitoring vital product adoption metrics might result in opportunity losses.

What do you miss if you don't measure product adoption?
It's common to prioritize vanity metrics when it comes to product adoption.
- Track the DAU/MAU ratio and know how many users love your product.
- Check NPS and know how good your word-of-mouth marketing is.
- Measure CSAT and find out the satisfaction levels of your customers.
They may look good on the surface but fail to provide a deep understanding of user behavior. The product adoption metrics are much more than these numbers.
A strategic and comprehensive measurement process is the key to not missing out on critical turning points and improvements.
Driving Business Growth and Revenue
Adoption rates, referral rates, upgrade rates...
They all directly correlate with the financial success of your product. They indicate the scalability of your business model and the ability to convert users into paying customers 💰💰
Monitoring these metrics helps identify opportunities to optimize pricing strategies, expand market presence, and increase revenue streams.
Understanding Users
Measuring product adoption helps you understand how actively users are engaging with your product. This includes insights into daily and monthly active users, session lengths, and frequency of use.
Without these metrics, you lack visibility into whether users are finding your product valuable enough to continue using it regularly.
Identifying Product Adoption Barriers
Most of the churns do not result from users hating your product. They result from confusion, uncertainty, or overwhelming feature complexity.
You can pinpoint these normally invisible barriers that prevent (potential) users from becoming paying loyal customers 🚧 🚧
Sometimes it's the lack of onboarding, sometimes unclear value proposition. Or, an unorganized knowledge base that turns users crazy while trying to find a how-to guide...
Metrics such as time to first use, onboarding completion rates, and feature adoption rates can help you identify these frictions. After identifying them, you make targeted improvements and solve your adoption problem.
Increasing Customer Satisfaction and Loyalty
If you don't conduct NPS and CSAT surveys, you can never know how satisfied and happy your customers are. And if you don't know that, you cannot increase their satisfaction.
Optimizing Product Development
Which features are used frequently, and which ones go unnoticed in your product? When you know them, you can prioritize development efforts based on user demand and behavior rather than mere assumptions.
Feature adoption rates, usage frequency, support ticket volume, average session duration... These adoption metrics provide insights into user attitudes toward features.
Without these insights, product development may lack direction and alignment with user needs. And you might end up with wasted resources and missed opportunities for innovation.
18 Product Adoption Metrics
Drum rolls, please! 🥁🥁
Here’s the ultimate list of the 18 most useful product adoption metrics to supercharge your success!
#1 Adoption Rate
Adoption rate measures the percentage of users who have started using a product or feature within a given time frame. It indicates how successfully a product or feature is being integrated into the user base.
It also helps assess initial interest and the effectiveness of marketing or onboarding efforts.
Adoption Rate=(Number of new users or adopters / Total number of users)×100
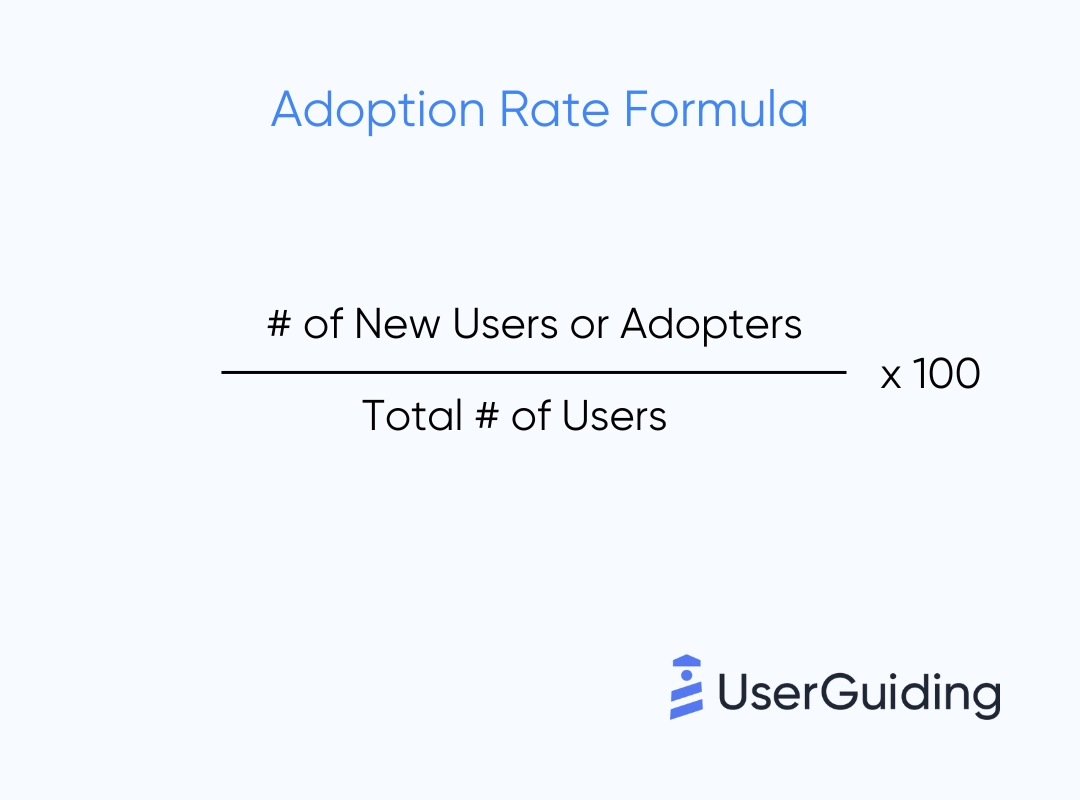
For example, if a new app gains 1,000 users in its first month and has a total user base of 10,000, the adoption rate is 10%.
#2 Feature Adoption Rate
Which features are popular, and how effectively are they integrated into user workflows? You'll find the answers here.
Similar to the product adoption rate, feature adoption rate measures the percentage of users who have started using a specific feature within a product.
Feature adoption rate guides feature prioritization and development. It also ensures resources are allocated to features that provide the most value.
Feature Adoption Rate=(Number of users using the feature / Total number of users)×100
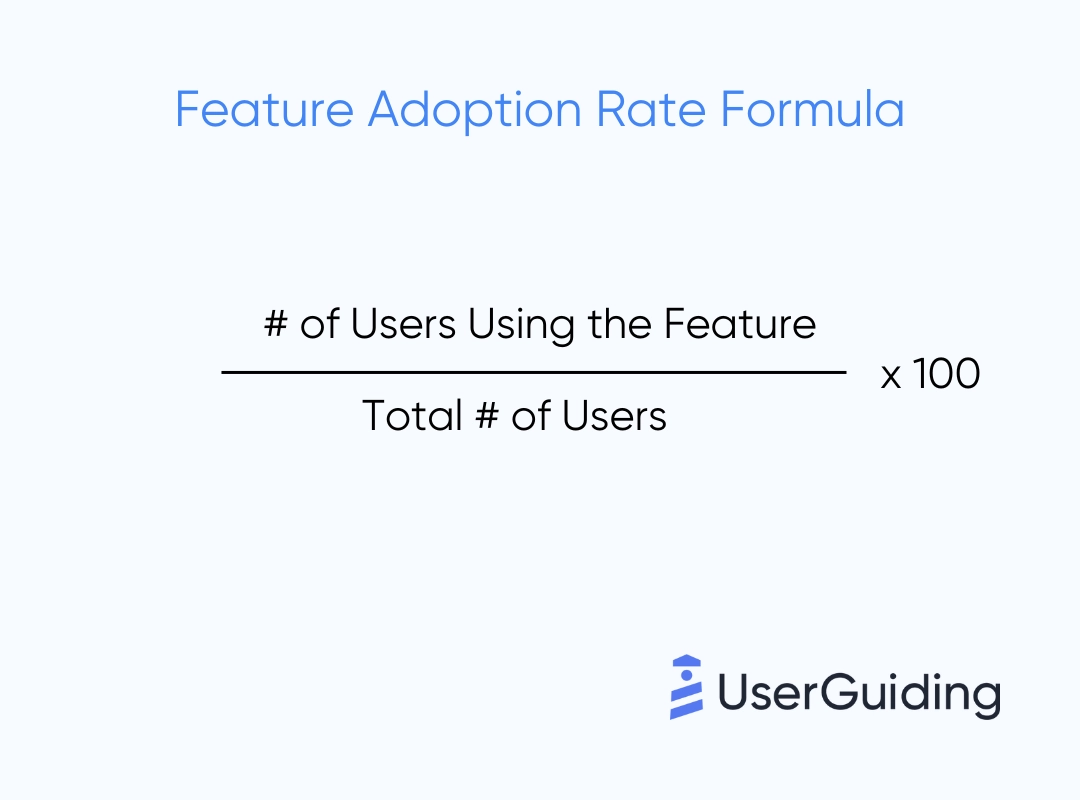
For instance, a social media platform might track how many users are using a new video-sharing feature compared to its overall user base.
#3 Conversion Rate
Conversion rate measures the percentage of users who complete a desired action, such as signing up for a service or making a purchase.
So you can evaluate how effective are your sales or marketing efforts in converting users into customers or achieving other predefined goals.
Conversion Rate=(Number of conversions / Number of visitors or users)×100

#4 Activation Rate
Activation rate measures the percentage of users who complete a key action that signifies their initial engagement with the product.
For example, a productivity app might measure activation rate based on users creating their first project.
Activation Rate=(Number of activated users/Total number of users)×100
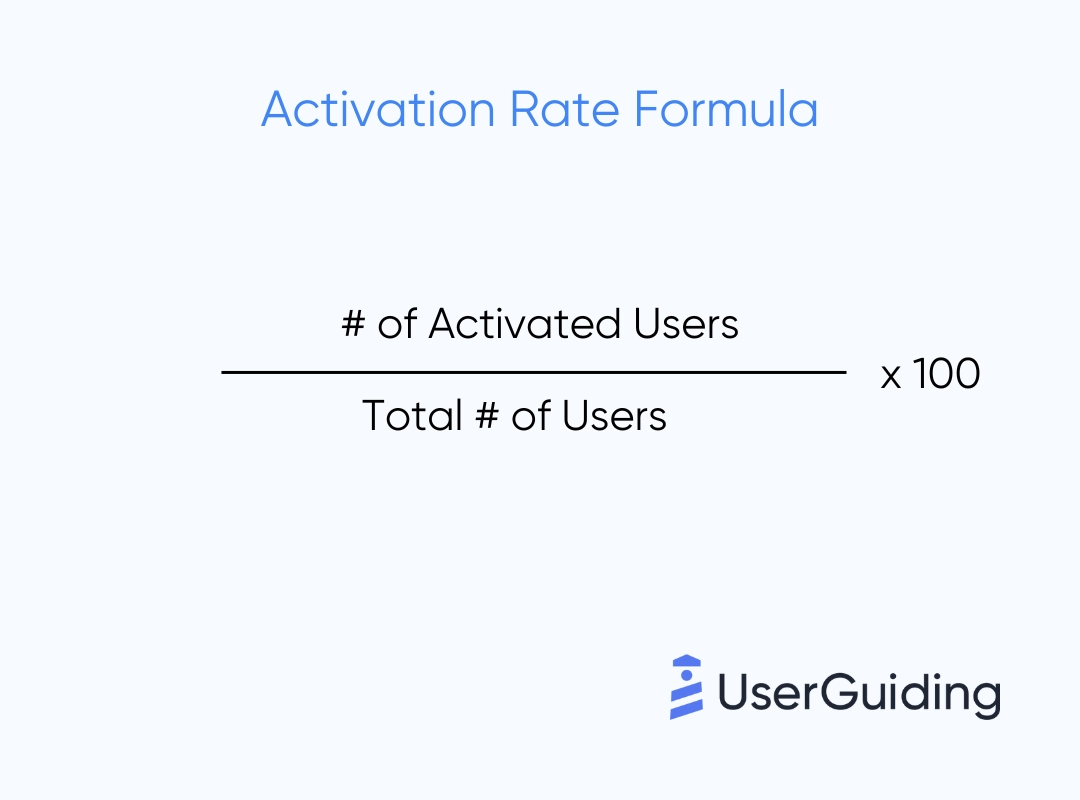
It helps determine how well users are onboarded and how quickly they start using core features. Monitoring the activation rate can also help you reduce churn and increase long-term user engagement.
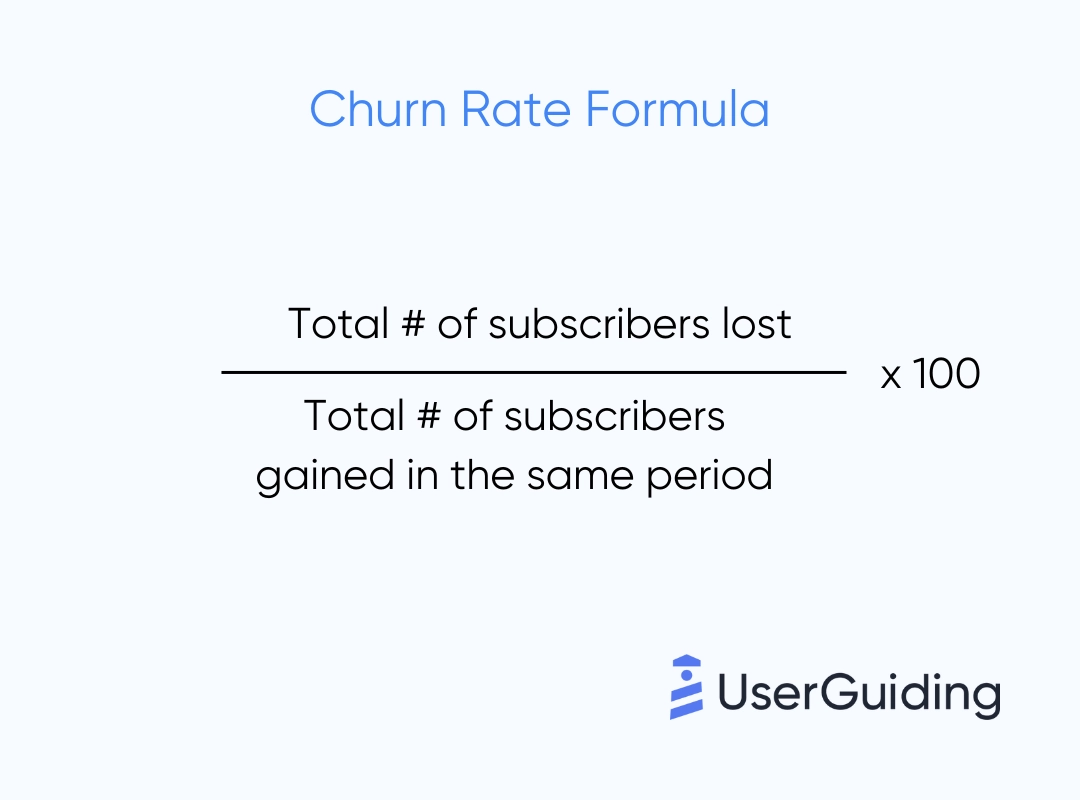
#5 Churn Rate
Churn rate measures the percentage of customers or users who stop using a product or service over a specific period.
It indicates customer retention and satisfaction levels reversely. Lower churn rates indicate higher customer satisfaction and retention, which are crucial for sustainable business growth.
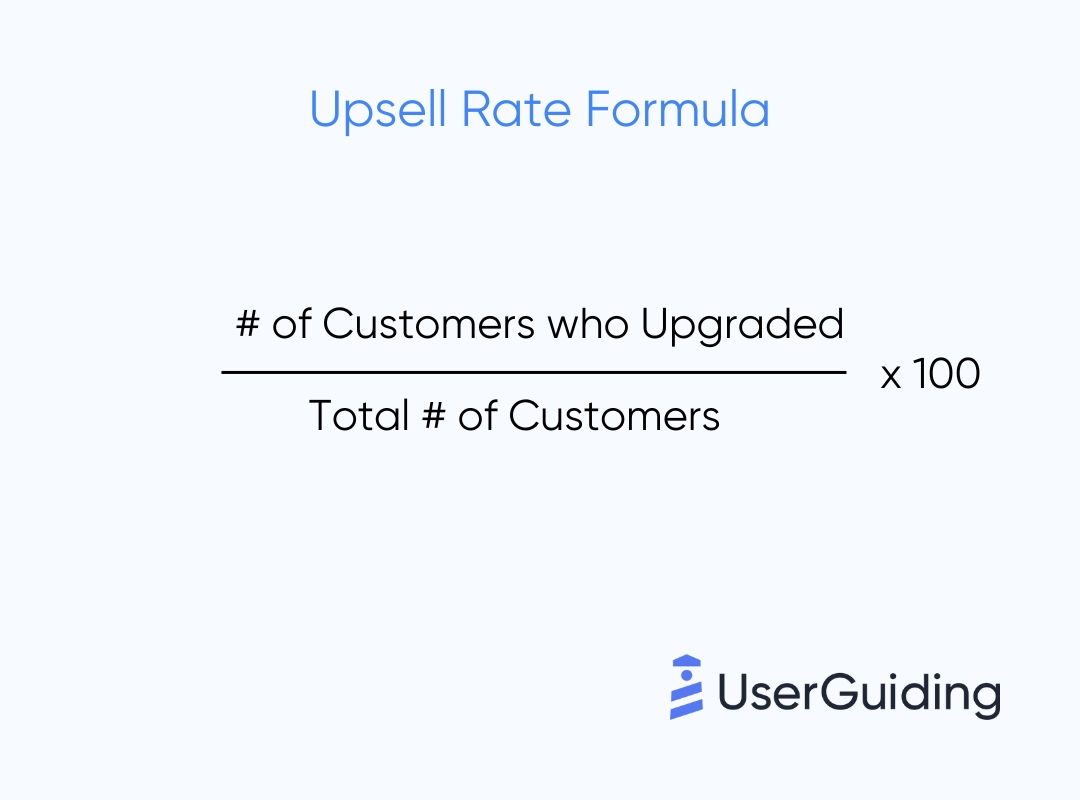
#6 Upsell Rate
Upsell rate measures the percentage of customers who upgrade to a higher-priced product or service.
Higher upsell rates indicate successful customer relationship management and increased average revenue per user (ARPU).
Monitoring your upsell rate can also help you optimize your pricing models and sales strategies for premium features.
Upsell Rate=(Number of customers who upgraded / Total number of customers)×100
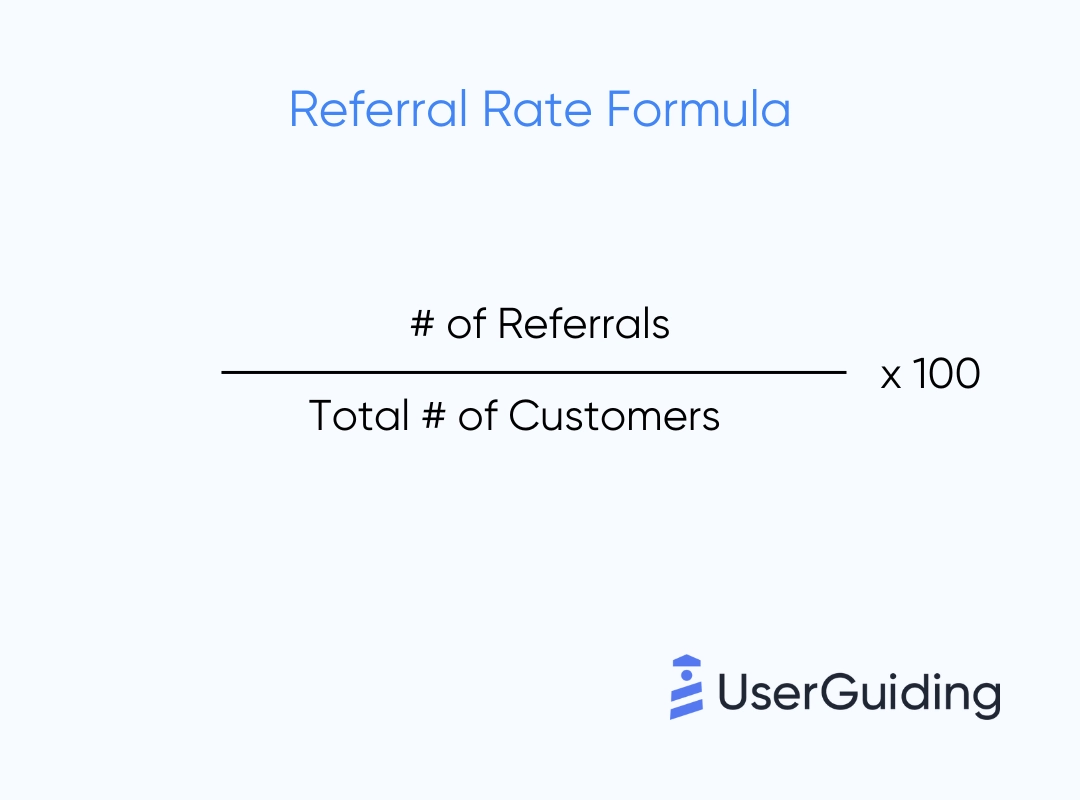
#7 Referral Rate
Referral rate measures the percentage of customers who refer others to use the product or service.
It quantifies word-of-mouth marketing effectiveness and customer satisfaction levels.
High referral rates indicate strong customer advocacy and can significantly reduce customer acquisition costs.
Referral Rate=(Number of referrals / Total number of customers)×100
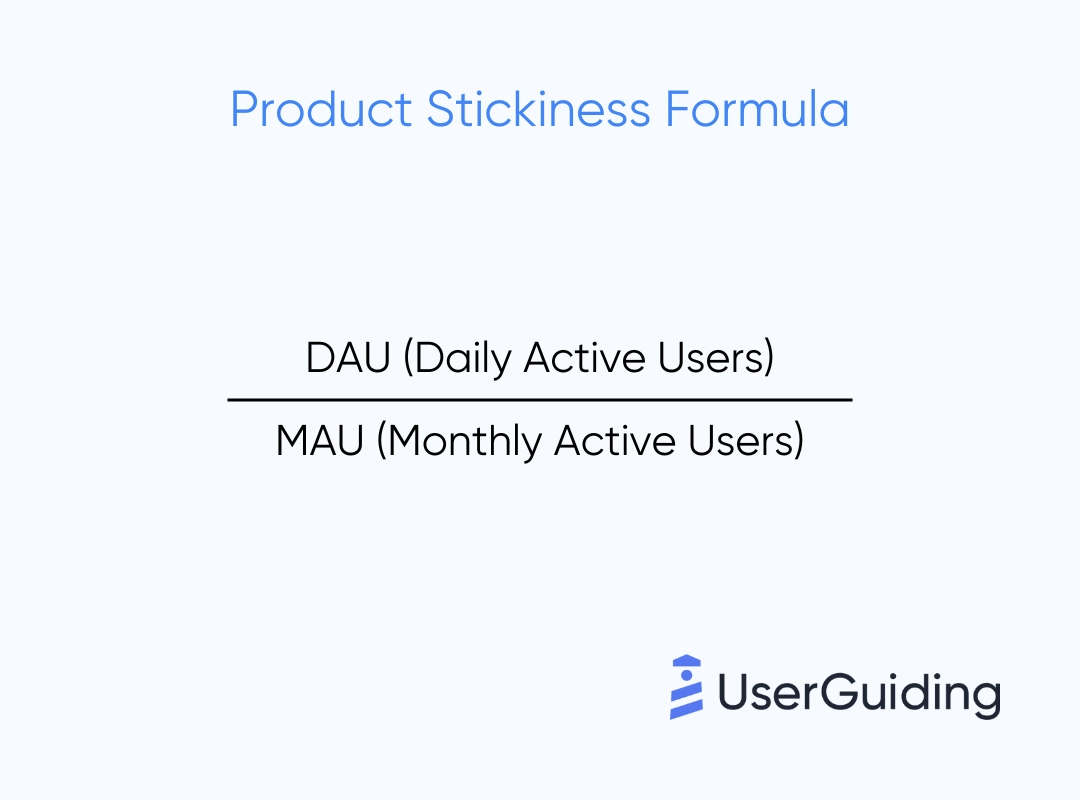
#8 Product Stickiness
Product stickiness measures how frequently users return to use a product or feature within a specific time frame. It indicates product engagement and user retention, essential for assessing long-term user value. Higher product stickiness suggests a strong product-market fit and a loyal user base.
#9 Time to First Key Action
Time to first key action measures the average time it takes for a user to complete a critical action after sign-up or installation. It's traditionally known as the Time to Value (TTV). Some people even call it the time for the "Aha!" moment.
You got the idea, name is not that important.
It evaluates the effectiveness of onboarding processes and user interface design in guiding users to initial value realization. Reducing the time to the first key action enhances user satisfaction and retention rates by demonstrating immediate product value.
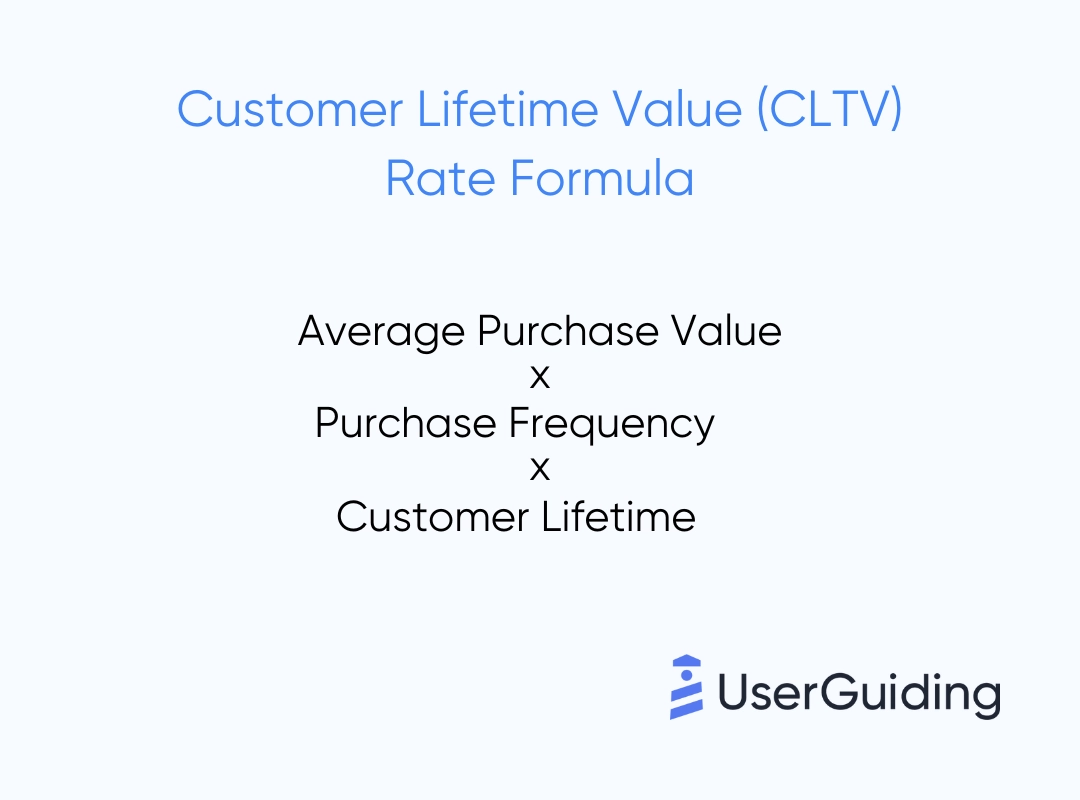
#10 Customer Lifetime Value (CLTV)
Customer Lifetime Value (CLTV) measures the total revenue or profit a customer generates throughout their relationship with the company. It quantifies the financial value of each customer.
So, you can make data-based decisions on customer acquisition and retention strategies.
CLTV=Average Purchase Value×Purchase Frequency×Customer Lifetime
#11 Number of Active Users
Number of active users measures the total number of users who engage with the product within a specific time frame.
It provides a snapshot of user engagement and platform usage and indicates product popularity and growth trends.
#12 Usage Frequency
Usage frequency measures how often users interact with the product within a given time frame.
It quantifies user engagement patterns and helps predict customer loyalty and retention rates. Higher usage frequency indicates strong product adoption and customer satisfaction.
Usage Frequency=Total number of interactions / Total number of active users

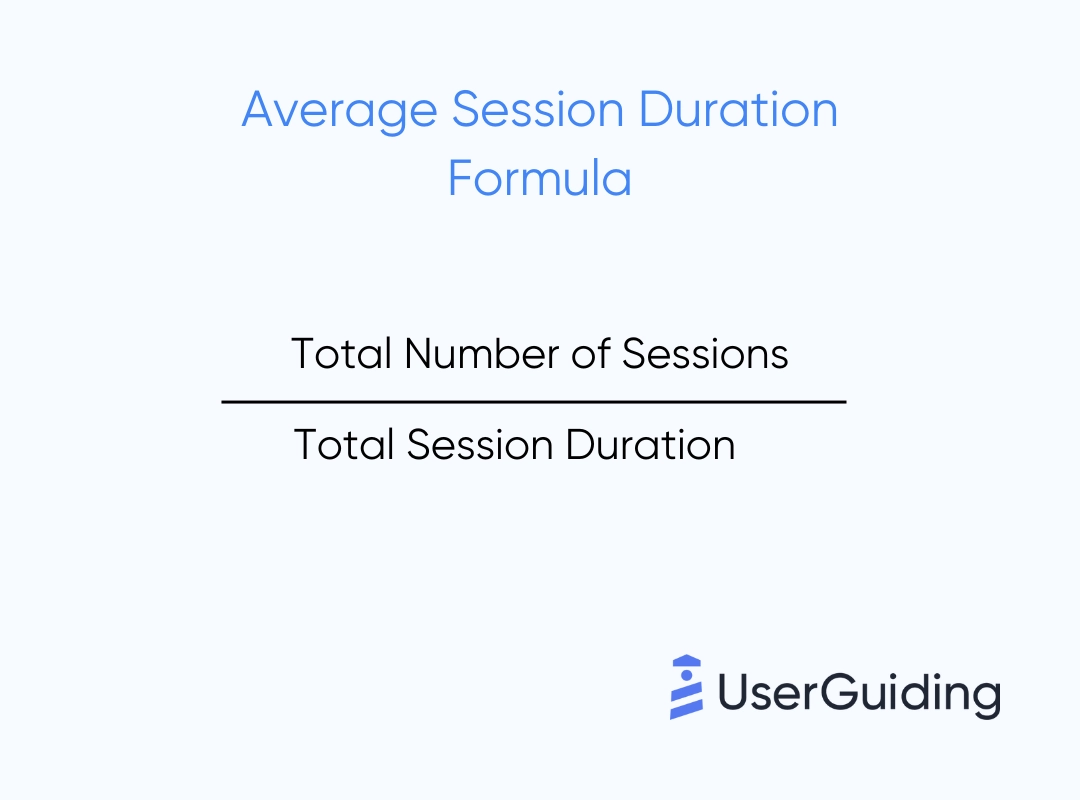
#13 Average Session Duration
Average session duration measures the average length of time users spend actively engaged with the product in a single session.
It evaluates user engagement levels and content relevance. Increasing average session duration indicates improved user satisfaction and stickiness.
#14 Net Promoter Score (NPS)
Net Promoter Score (NPS) measures customer loyalty and satisfaction. NPS surveys ask one simple question: "How likely are you to recommend our product/service to a friend or colleague?".
However, you can always ask NPS follow-ups to understand the reasoning behind the respondents' scores.
NPS categorizes respondents into Promoters (loyal enthusiasts), Passives (satisfied but unenthusiastic ones), and Detractors (unhappy customers).
- Promoters: respondents rating 9-10
- Passives: respondents rating 7-8
- Detractors: respondents rating 0-6
NPS=%Promoters−%Detractors

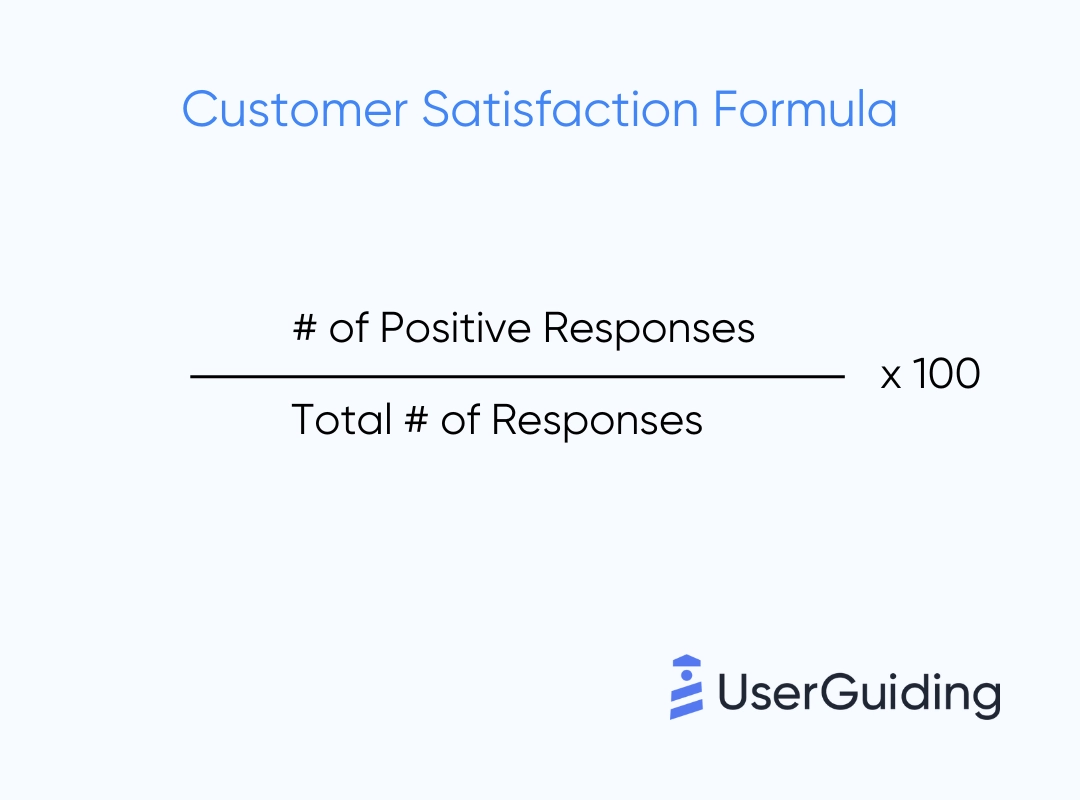
#15 Customer Satisfaction (CSAT)
Customer Satisfaction (CSAT) measures how satisfied customers are with a product or service based on a specific interaction or experience.
A CSAT survey typically uses a rating scale (e.g., 1-5 or 1-10). It provides immediate feedback on recent customer experiences.
CSAT= (Number of Positive Responses / Total Number of Responses) x 100
#16 Support Ticket Volume
Support Ticket Volume measures the number of customer support tickets received within a specific period. It quantifies customer inquiries, issues, or requests for assistance. And it reflects the workload and effectiveness of the support team.
Once you identify recurring problems, you can optimize your knowledge base and implement a self-serving help center for your users.
By curating comprehensive and easily accessible tutorials and articles, you can educate users on product features and troubleshooting steps.
As they find answers quickly through the knowledge base, the workload on the support team might also decrease significantly.
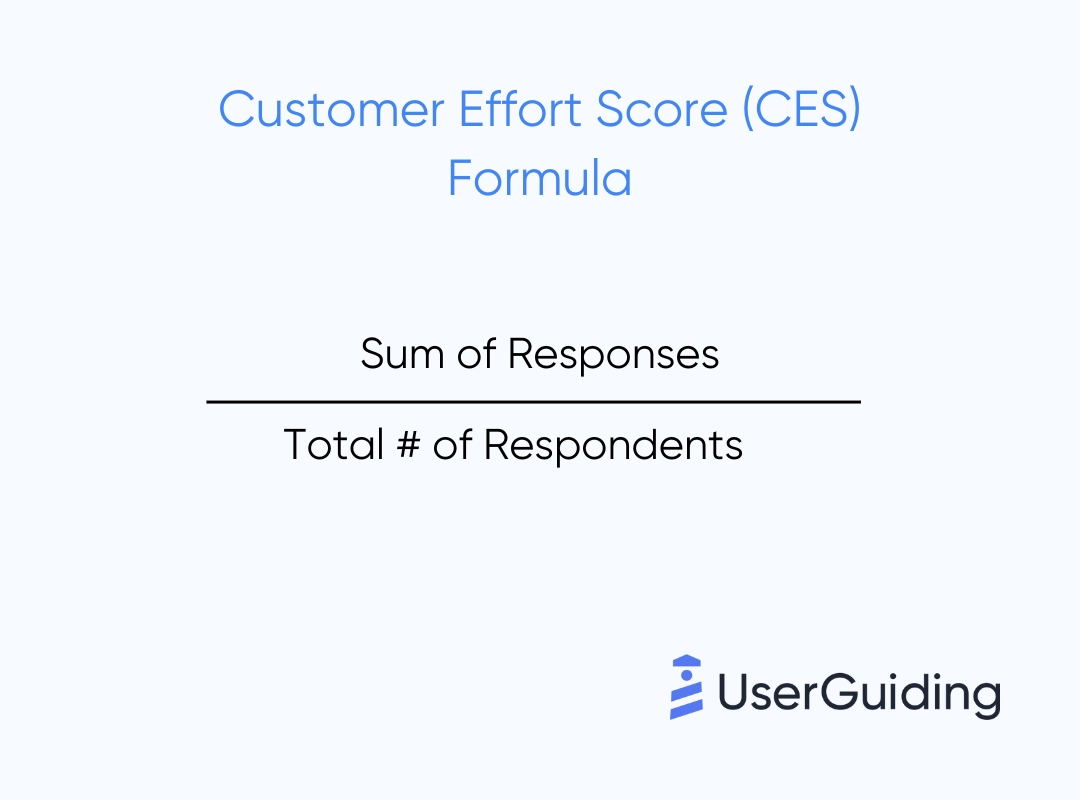
#17 Customer Effort Score (CES)
Customer Effort Score (CES) measures the ease of customer experience when resolving an issue or completing a task.
CES surveys use a scale to gauge how much effort customers feel they exerted to achieve a goal or resolve an issue. It focuses on minimizing customer effort for improved satisfaction.
CES=(Sum of responses / Total number of respondents)
The Customer Effort Score (CES) can vary depending on how you frame your survey question and the scale used.
For instance, asking "How easy was it to use this product?" yields different insights than asking "How hard was it to use this product?".
It's crucial to consider the wording and perspective of your question to interpret CES results accurately.
Additionally, you can use emoji reactions similar to NPS or CSAT, where positive responses are proportioned against negative ones. In that case, you can use a formula like this:
CES= (Number of positive responses / Total responses) X 100
#18 Product Engagement Score (PES)
Product Engagement Score (PES) measures the level of interaction users have with a product or platform over time. It combines the impact of product stickiness, adoption rate, and growth.
It provides a concrete method to gauge the impact of your efforts —whether in marketing, development, or customer enablement.
It offers insights into areas needing improvement and highlights successful strategies worth further investment.
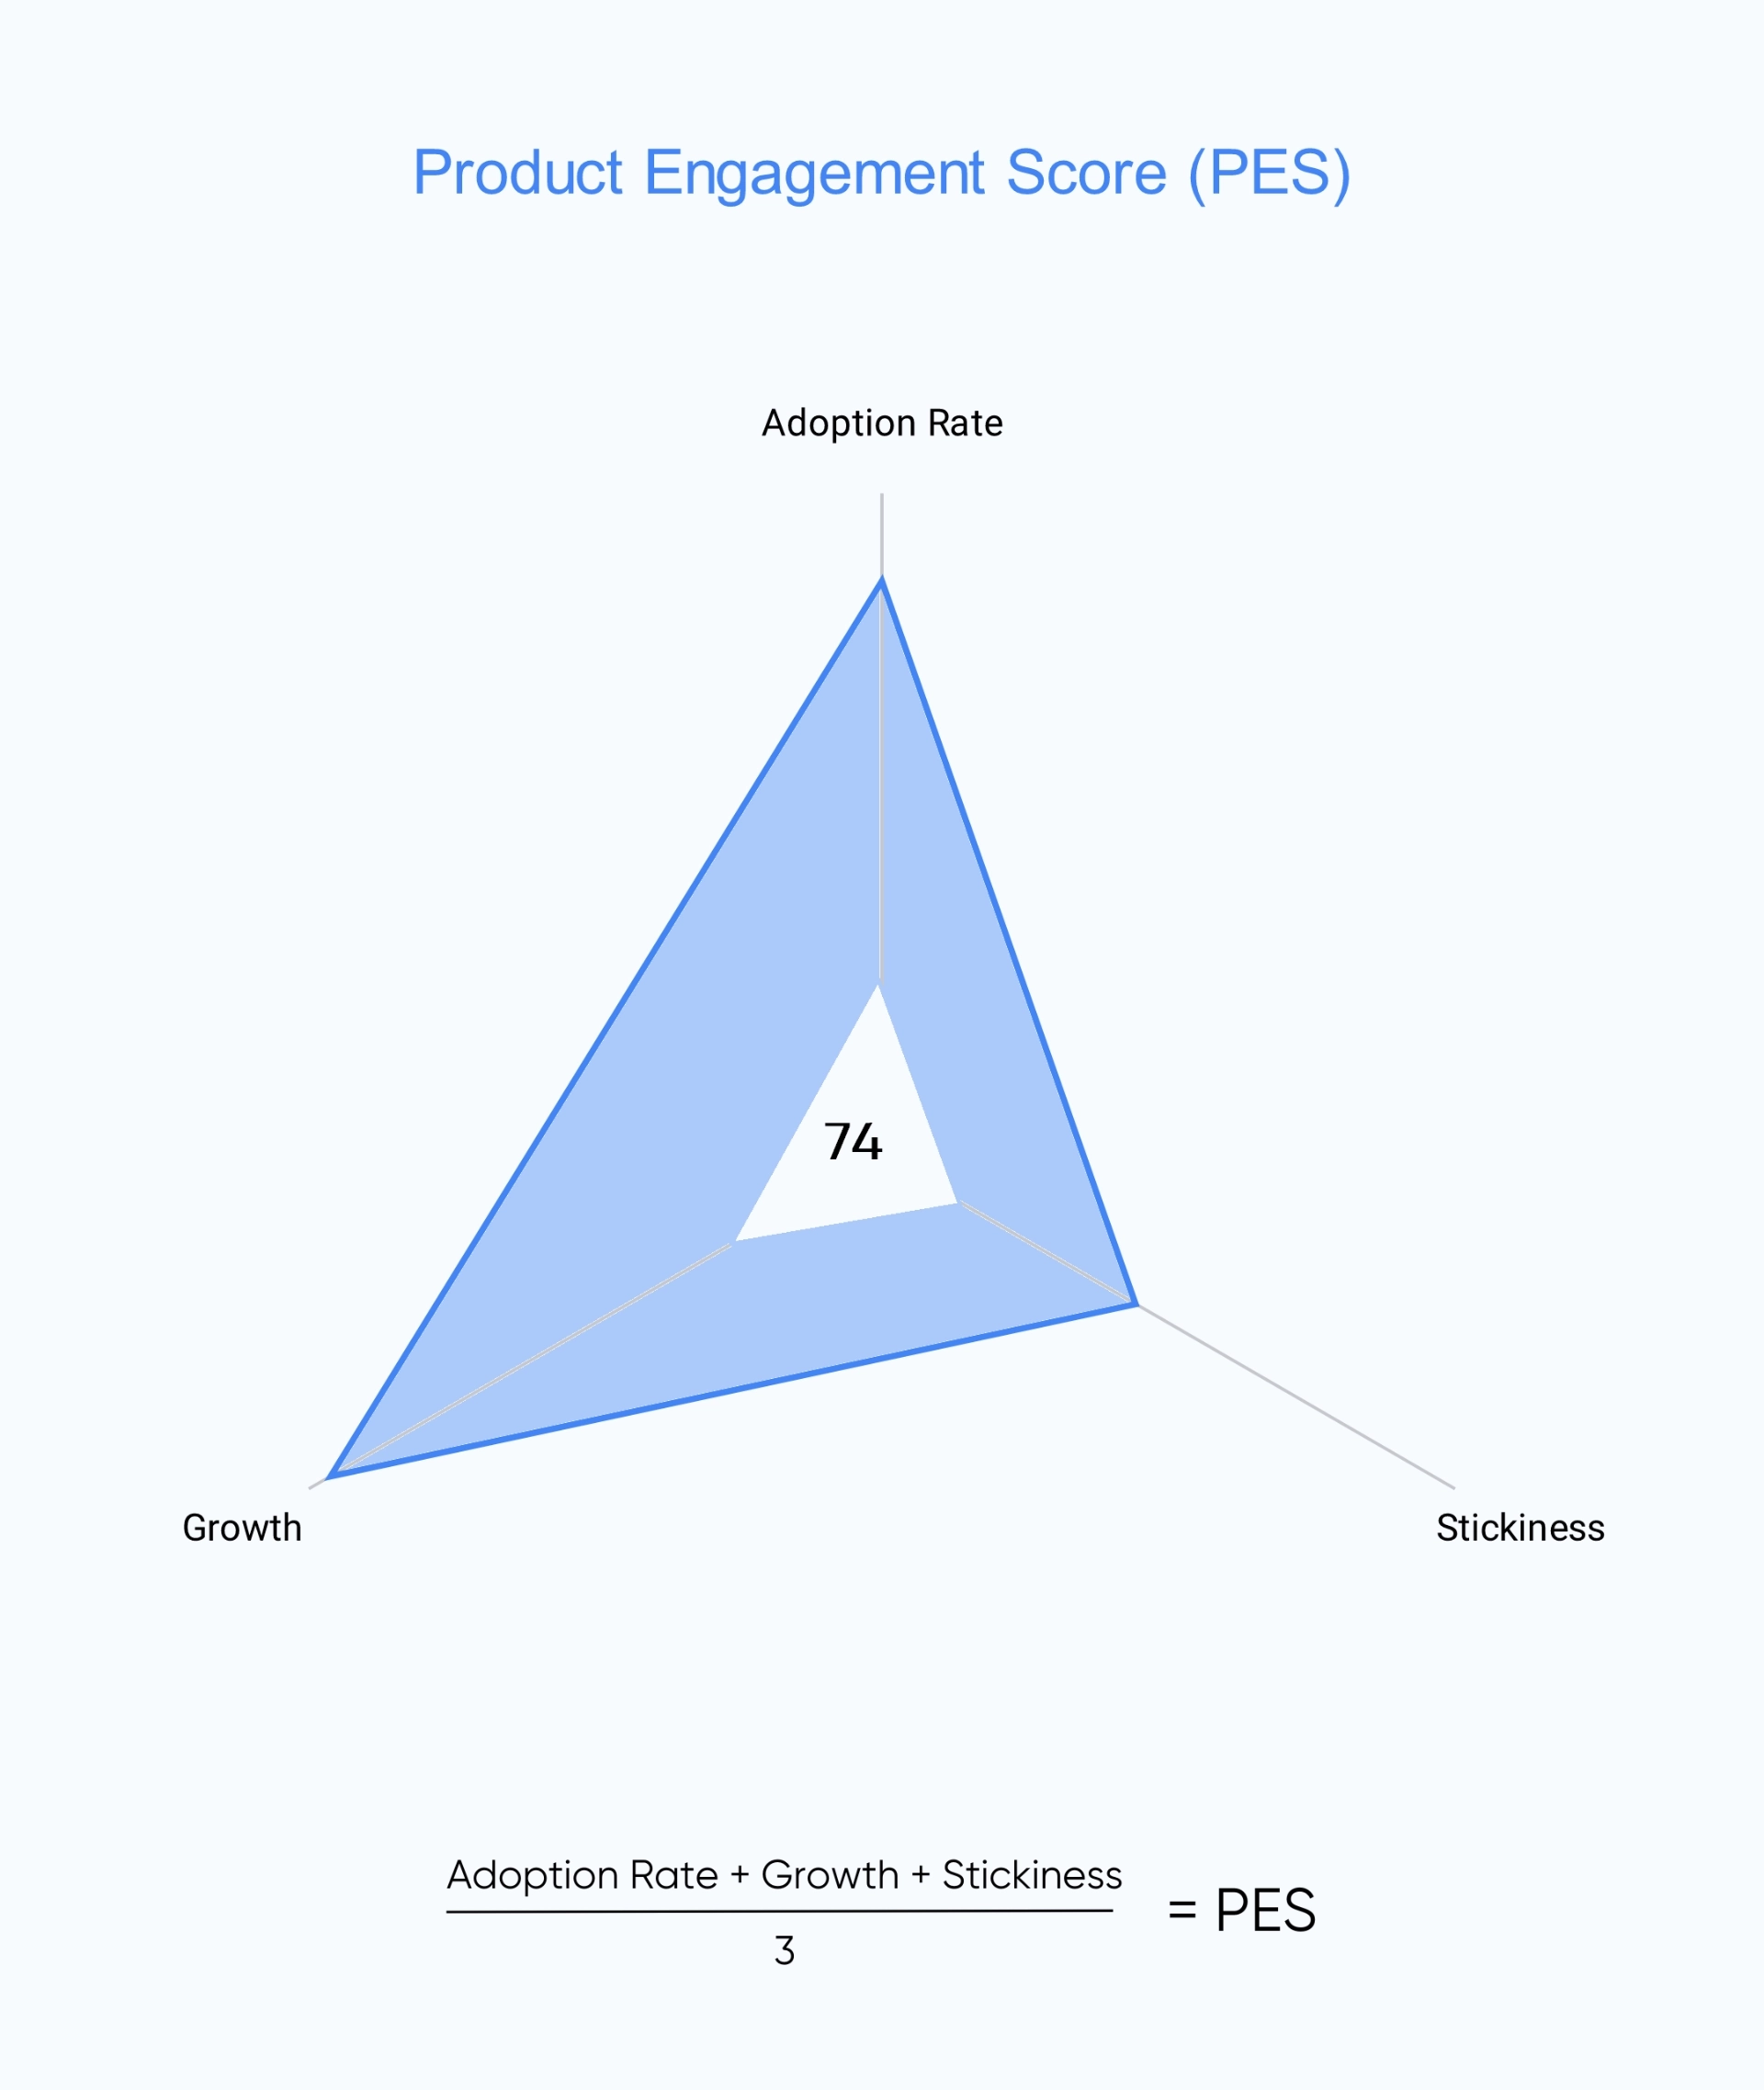
👉🏻 Here's why measuring PES is important and how it can help your business
Do You Need to Measure All the Product Adoption Metrics?
No, thankfully you don't need to.
Not every product is suitable for all these metrics. Or, not every business prioritizes the same goals and has the same KPIs.
➡️ For example, for a platform like Duolingo, the average session duration or usage frequency might provide really valuable insights. However, for an invoicing tool like Ruul, those metrics might not be really useful.
➡️ Similarly, the DAU/MAU ratio might be very important for a social media platform like Pinterest. However, it might not properly indicate user satisfaction for a platform like Adobe Creative Cloud.
How to Choose Which Metrics to Measure?
It's not that hard to decide on which metric to monitor. You just need to know your product, your users, your business goals, and that's all.
—And maybe the position of the Mercury 🌌

Step 1: Define Your Business Goals and Objectives
First and foremost, begin by clearly defining what you aim to achieve with your product measurement efforts.
Are you focused on increasing user engagement? Reducing churn? Improving user satisfaction? Or increasing revenue?
Different goals may require prioritizing different metrics. For example, revenue growth may prioritize metrics like upgrade rates, whereas user satisfaction may focus on CSAT or NPS. Knowing your goals helps in selecting metrics that directly contribute to achieving them.
Step 2: Understand your User Journey and Lifecycle
Different metrics can be relevant at different stages of the user journey. In order to choose which metric to use, where, and when, you need to understand the user journey first.
For that, you need to map out the typical user journey—from initial awareness and onboarding to regular use and potential churn.
Identify key touchpoints where user interactions are critical. This understanding can help you select metrics that track user behavior throughout their lifecycle with the product.
Step 3: Identify Key Performance Indicators (KPIs)
Based on your goals and user journey analysis, you need to identify Key Performance Indicators (KPIs). They must directly reflect progress towards achieving those goals.
They should also be measurable, actionable, and indicative of the overall health and success of your product adoption strategy.
For example, if your business goal is to increase sales, some of your KPIs can be revenue growth, conversion rate, and average order value.
Or, if revenue growth is your primary objective, focus on KPIs such as customer lifetime value (CLV), upgrade rate, and churn rate.
Step 4: Establish a Monitoring Process
Once you select your metrics, you need to establish a process for ongoing monitoring, analysis, and review.
You should regularly revisit chosen metrics to ensure they remain relevant and aligned with evolving business goals as well as user needs. You can adjust metrics as necessary based on feedback and changing market conditions.
For this step, you can utilize analytics software, CRM platforms, or product adoption tools. These tools enable efficient data collection and user behavior tracking. They also help with customer segmentation and performance dashboards.
Step 5: Compare Your Data with Industry Standards and Benchmarks
Industry standards and benchmarks can help you understand your data. They provide context and help you set realistic expectations for your own metrics. This way, you can also identify areas for improvement clearly.
You can leverage industry benchmarks to gain a competitive advantage over your competitors.
By analyzing these benchmarks, you can identify your strengths and your competitors' weaknesses. This can allow you to strategically highlight and capitalize on these areas.
In Short...
Product adoption metrics can be intimidating.
There are many of them, and you need to be careful when choosing which ones to monitor and when.
If you do not monitor crucial metrics, you might overlook critical aspects of the user journey or miss potential growth opportunities. Conversely, you might tire, stress, and beat yourself unnecessarily if you monitor irrelevant ones.
However, once you know what to track, no one can stop you.
You can understand your users, their needs, usage patterns, and expectations. Then, you can (almost) fully control your product experience and grow your business with your happy customers.
Frequently Asked Questions
What is an adoption metric?
An adoption metric shows how users respond to a product or its features. It indicates whether users are incorporating a product or feature into their regular usage. There are many product adoption metrics that help teams assess the success of their efforts, product processes, and campaigns. The most popular ones are: feature adoption rate, customer conversion rate, product stickiness, usage frequency, and user engagement score.
How to calculate adoption score?
To calculate an adoption score, you can use various formulas depending on the specific metric you want to measure. For the product adoption score, the formula is as follows:(New Engaged Users / Total Signups) x 100. For the feature adoption score, it's like this: (Users who Adopted a Specific Feature / Total Number of Users) x 100.
What are the 5 product characteristics and rate of adoption?
According to Everett Rogers's diffusion of innovations theory, five aspects influence a product's adoption rate. These are relative advantage, compatibility, complexity, trialability, and observability of a product and its usage. Relative advantage refers to the degree to which a product is perceived as better than its alternatives. Compatibility is the degree to which the product fits into existing practices and needs of potential users. Complexity is about the level of difficulty in understanding and using the product. Trialability shows the ability of individuals to test the product before purchasing it. And observability is the extent to which the results of product usage are visible to the potential users before making a commitment.

.png)