.svg)
.svg)
.svg)
.svg)
.svg)


.svg)


.svg)
.svg)

In February 2026, the market sent a message.
Nearly $1 trillion in software market value vanished in weeks during the “SaaSpocalypse.” AI-native tools exploded. Enterprises started replacing SaaS with internal builds. Switching costs shrank. Customer acquisition cost (CAC) climbed over 222% over eight years. Sales cycles stretched past 130 days.
At the same time, thousands of new AI tools flooded the market. Users tried them, then they churned.
Today, median B2B SaaS net revenue retention (NRR) sits around 101–106% while AI-native companies are closer to 48%, according to ChartMogul.
When acquisition is expensive, loyalty gets fragile. Differentiation gets harder than ever.
So what’s the next move? User retention. Not as a lever but as a business model. Because if users don’t stay (and expand), you don’t grow.
In this article, you’ll learn what user retention really means in 2026, which metrics stay relevant, and how you can turn retention into your growth engine.
Let’s begin.
TL;DR
- 59% of customers walk away from a contract after three or fewer bad experiences. Not matching what native AI tools deliver, decrease in switching costs, and silent disengagement are top reasons why users churn — because there’s always a better alternative one click away.
- A retention-first framework supports user retention. Accelerating time-to-value, investing in sticky feature adoption, building an AI-powered self-service ecosystem, and operationalizing customer health goes beyond collecting data and looking at metrics.

What User Retention Really Means in 2026
Retention used to mean “they logged back in.”
Now it means: Users repeatedly get value and deepen their commitment over time. That’s the shift.
Now, you need to ask, “Are they still active?” to determine user retention. It also includes expansion. Since existing customers now generate 40–50% of new ARR in growth-stage SaaS, you can turn this into an advantage.
So much so that there’s a possibility to double your revenue in five years without acquiring new customers at all.
What user retention really means in the year of 2026, then, is compounding growth.
The Retention Metrics That Matter in 2026
If you don’t measure retention, you can’t fix it when it’s broken. Here are 10 metrics to monitor in 2026 (and beyond)👇
Core Metrics
1) User Retention Rate
Formula:
[(End users - New users) / Start users] x 100 = % Retention rate
For example, let’s say that you start with 1000 users, then acquire 200. And end with 950. The formula would look like:
[(950 - 200) / 1000] x 100 = 75% retention
Best-in-class SaaS companies retain 56.6% of their users in a three-month period, so the company in the example above has a great retention rate.
2) Churn Rate (voluntary vs involuntary)
There are two types of churn: Voluntary and involuntary.
Voluntary churn happens when a user actively chooses to end their contract or cancel their subscription, often due to poor customer experience.
Involuntary churn, on the other hand, happens outside of customers’ control, such as payment declines or technical failures, rather than bad experiences.
It has a very easy formula for measurement:
100 - Retention rate = Churn rate
Average B2B SaaS churn was 3.5% monthly. And enterprise churn was often around 1-2% annually. So, if you have anything higher, you’re basically bleeding.
3) Cohort analysis
Overall retention rate doesn’t tell much on its own. Some even categorize it as a “vanity metric,” though we don’t go as far as to suggest that.
To leverage retention, however, you need to understand when and why users leave. And that’s possible with cohort analysis.
Instead of looking at all the users together, you group them by a shared starting point (usually signup month, activation date, or first purchase) and track how each group behaves over time.
That’s how you spot patterns.
When you build a cohort retention table or curve, watch for:
➡️ The First Drop (Activation Cliff)
If retention falls sharply in the first 7–30 days, users aren’t reaching value fast enough. Improve Time-to-First-Value.
➡️ The Slow Decay (Engagement Erosion)
If retention gradually declines after month two, feature adoption is weak. Users haven’t embedded the product into workflows.
➡️ The Plateau (Core Users Identified)
If retention stabilizes at a certain percentage, that’s your true product-market-fit base. Study these users. They hold the blueprint.
Revenue Metrics
4) Gross Revenue Retention (GRR)
Gross Revenue Retention (GRR) basically asks, “What revenue did you keep?” It includes revenue retained from existing customers, including expansions.
Median B2B SaaS NRR is around 90%, while the top quartile is more than 95%.
Here’s how to calculate GRR:
[(Starting Monthly Recurring Revenue (MRR) - Churn - Downgrades) / Starting MRR] x 100 = % GRR
A high GRR indicates strong product-market fit, and customers are satisfied with what you offer. In other words, your value isn’t just perceived by you but also by your customer base as well.
5) Net Revenue Retention (NRR)
Net Revenue Retention (NRR) is the metric that separates surviving SaaS companies from scaling ones.
Here’s the formula:
[(Starting revenue + Expansion revenue - Churn - Downgrades) / Starting revenue] x 100 = % NRR
NRR shows whether your existing customers grow or shrink over time.
Above 100%? You’re compounding.
Below 100%? You’re backfilling losses.
Keep in mind that median B2B SaaS NRR sits around 101-106%. Elite companies exceed 120%. AI-native startups, on the other hand, sit far lower.
6) Expansion revenue
Expansion revenue is growth from customers you’ve already won. It includes upgrades, add-ons, seat increases, usage overages, and cross-sells. No new logos. No new CAC. Just a deeper value.
It’s also the proof that your product is embedded. If customers expand, they’re seeing increasing ROI. If they don’t, you’re replaceable.
Track expansion rate alongside NRR. Tie upgrade triggers to usage milestones. Build natural growth paths into pricing.
Here’s how you can calculate expansion revenue:
[(Expansion MRR at the end - Expansion MRR at the start) / Expansion MRR at the start] x 100 = % Expansion revenue
Product-Led Metrics
7) Time-to-First-Value (TTFV)
Time-to-First-Value (TTFV) measures how quickly a new user experiences meaningful value from your product. Not when they sign up, not when they log in. But when they hit the “this is useful” moment.
Shorter TTFV = higher retention.
In a world where users trial five tools before lunch, speed matters. If value takes weeks, they churn in days.
Track the time between signup and first core action (e.g., first report generated, first workflow automated, first integration completed). Then remove friction aggressively.
8) Feature Adoption Rate
Feature Adoption Rate measures how many users engage with the features that drive retention.
Here’s the formula:
(Users who used the feature / Total active users) x 100 = % Feature adoption rate
It’s important to remember that not all features matter equally for different user segments. Identify the ones strongly correlated with long-term retention (advanced workflows, integrations, collaboration tools) and push users toward them.
Companies with 70%+ feature usage see significantly higher retention likelihood. And if adoption is shallow, expansion stalls.
That’s why it’s helpful to think about feature adoption as the bridge between activation and NRR.
9) Customer Health Score
Customer Health Score is your early-warning system. It’s a composite metric combining signals like:
- Login frequency
- Feature depth
- Support tickets
- Billing status
- NPS or sentiment
- Contract renewal proximity
You assign weighted values and categorize accounts as green, yellow, or red: Green expands. Yellow needs nudges. Red needs intervention.
Companies that operationalize health scoring see 6–12 point lifts in NRR because they act before churn happens. In other words, health scores turn retention from reactive to predictive.
10) Customer Effort Score
Customer Effort Score (CES) measures how hard it is for users to accomplish what they came to do. Typically asked as:
“How easy was it to complete your task?” (1 = very difficult, 5 or 7 = very easy)
If users struggle to configure workflows, find help, or understand features, they disengage, even if the product is powerful. And high effort kills retention quietly, while lower effort increases stickiness.
What does CES look like in the AI era? As friction tolerance is near zero, you need to make the core job effortless. You can achieve this with strong onboarding, self-service resources surfaced at the right moments, and proactive customer support.
Why Users Churn in the AI Era
Churn today isn’t about one bad experience. But on average, 59% of customers walk away after three or fewer bad experiences. Because there’s always a better alternative being one click away.
Here are other reasons why customers churn in the age of AI👇
1. AI Reset Expectations
AI-native tools respond instantly, personalize automatically, and anticipate needs. Users now expect:
- Sub-second performance
- Context-aware experiences
- Proactive guidance
If your SaaS can’t deliver this, customers will categorize it as outdated. To put it simply, the comparison isn’t your competitor anymore. It’s AI-native UX.
2. Switching Costs Are Collapsing
AI-powered migration tools now move data in days instead of months. Build-vs-buy decisions are happening inside teams without IT oversight. Internal tools are being spun up with AI coding assistants on a weekend.
If your product isn’t embedded in workflows, you’re replaceable.
3. Silent Disengagement
91% of unhappy customers don’t even complain. They log in less. They stop using advanced features. They downgrade. And eventually, they quietly leave.
If you aren’t tracking behavioral signals, churn will look like a surprise. It never is. A broken customer experience always shows signals, but it’s up to you to act on them before it snowballs.
The Retention-First Framework for SaaS in 2026
Retention is a system that runs across product, support, pricing, and analytics.
But creating a retention-first framework in 2026 is more than looking at metrics.
Here’s the playbook👇
1. Accelerate Time-to-Value
Shorten the gap between signup and meaningful outcome. Not “completed setup.”
Not “watched tutorial.” Actual value.
If you’re a project management tool, that might be the first task completed. If you're using analytics software, it’s the first report generated. If you’re HR tech, it’s the first automated workflow running.
Use:
- Interactive onboarding
- Contextual tooltips
- Guided checklists
- Progressive disclosure
SaaStr recommends pushing activation rates toward 95% in the first 30 days. Value delayed is churn accelerated.
2. Drive Sticky Feature Adoption
Users might test and use a feature a few times, but that doesn’t mean they have adopted it. Sticky adoption should be your goal: Create experiences that encourage users to return to engage frequently and consistently.
How? Identify the 2–3 features that correlate most strongly with long-term retention. Then design journeys that drive users there.
For example:
- If integrations increase retention, prompt integration setup early.
- If automation drives stickiness, guide users to build their first automation within week one.
- If collaboration increases expansion, nudge team invites before month two.
Use in-app nudges. A/B test prompts. Trigger walkthroughs based on behavior. Retention lives inside usage depth.
3. Build an AI-Powered Self-Service Ecosystem
We’ve mentioned that customer support is no longer a cost center and that it’s a retention engine.
But to have that effect, you need to restructure how you think about delivering support. Because users expect instant answers that are accurate the first time. Waiting 24 hours for a reply feels broken.
Structure support in layers:
- Tier 0: Knowledge base + AI assistant
- Tier 1: General support agents
- Tier 2–3: Specialists
AI chatbots can handle up to 80% of your routine requests. Virtual assistants can reduce inbound tickets dramatically. But here’s the real retention impact:
When help is embedded inside the product, users don’t leave to find answers. And users who don’t leave… don’t churn.
4. Operationalize Customer Health and Proactive Intervention
Stop guessing which accounts are at risk. Build a health score model using:
- Login frequency
- Feature usage depth
- Support activity
- Billing behavior
- NPS or sentiment signals
Color-code accounts. Trigger interventions automatically.
If usage drops 40% in 30 days, trigger a re-engagement flow.
If renewal is 60 days away and adoption is shallow, schedule proactive outreach.
When you have an established framework, it’s easier to boost your NPS points and retention becomes much easier to improve when intervention is systematic.
5. Demonstrate Continuous Value
Users churn when they believe the product is stagnant. Therefore, you need to make progress visible. Here are many ways to achieve that, but here are 4 popular options:
- In-app product updates
- Targeted announcements
- Feature adoption campaigns
- Feedback loops tied to releases
What do these look like in practice?
Let’s assume that you’re releasing a new AI workflow builder. Don’t just ship it. Guide relevant users to try it. Show how it saves time. Measure adoption.
When you do that, expansion often follows. Because users are aware of what your product or service actually offers. Don’t fall into the trap of silence as it kills momentum. Make your effort visible, so you can build loyalty.
How UserGuiding Powers Product-Led Retention
Retention systems need infrastructure. UserGuiding’s Knowledge Base, AI Assistant, Product Updates, and Resource Center work together to shorten time-to-value, increase feature adoption, and reduce churn — with real, documented customer results👇
Knowledge Base
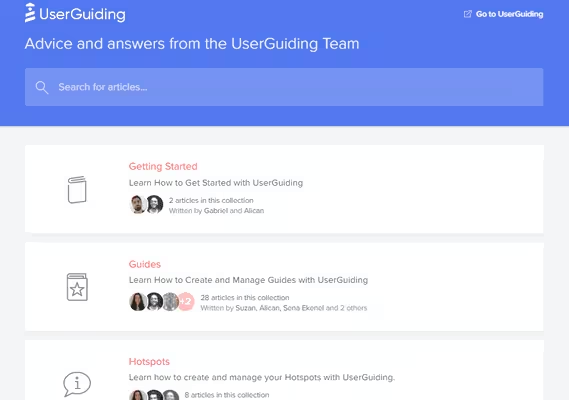
Users don’t churn because they hate your product. They churn because they get stuck.
UserGuiding’s Knowledge Base centralizes support content in a fully branded, searchable help hub. And integrates it directly into the product via the Resource Center. That means users don’t leave your app to Google solutions.
That matters because 67% of users prefer self-service and 91% will use a knowledge base if it meets expectations.
For example, CuePath reported a 72% decrease in support calls after implementing UserGuiding’s Knowledge Base. Self-service reduced their friction points. And reduced friction protected retention.
And because the Knowledge Base feeds directly into the AI Assistant, it becomes the foundation of a smarter support loop.
AI Assistant
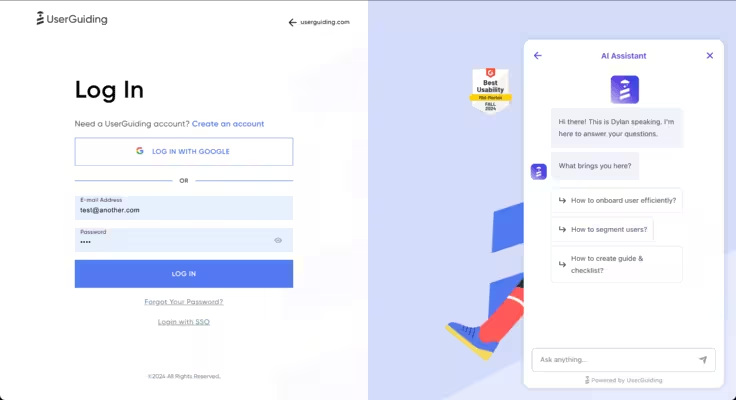
Support moments are also churn moments. Unless you convert them into activation moments.
UserGuiding’s AI Assistant (powered by GPT-4) does more than answer questions. It can trigger interactive guides directly inside the chat when a user asks about a feature.
And usually that turns into the difference between “Here’s an article” and “Let me show you.”
Take a look at this👇
Indicata implemented the AI Assistant and saw a 47% increase in feature adoption.
That’s retention-level impact.
Internally, UserGuiding’s own support team increased auto-resolved tickets from 15% to 40% in one year after deploying the AI Assistant, which eliminated the need to hire another support agent.
More tickets resolved instantly. More features discovered. More users reaching value.
Product Updates
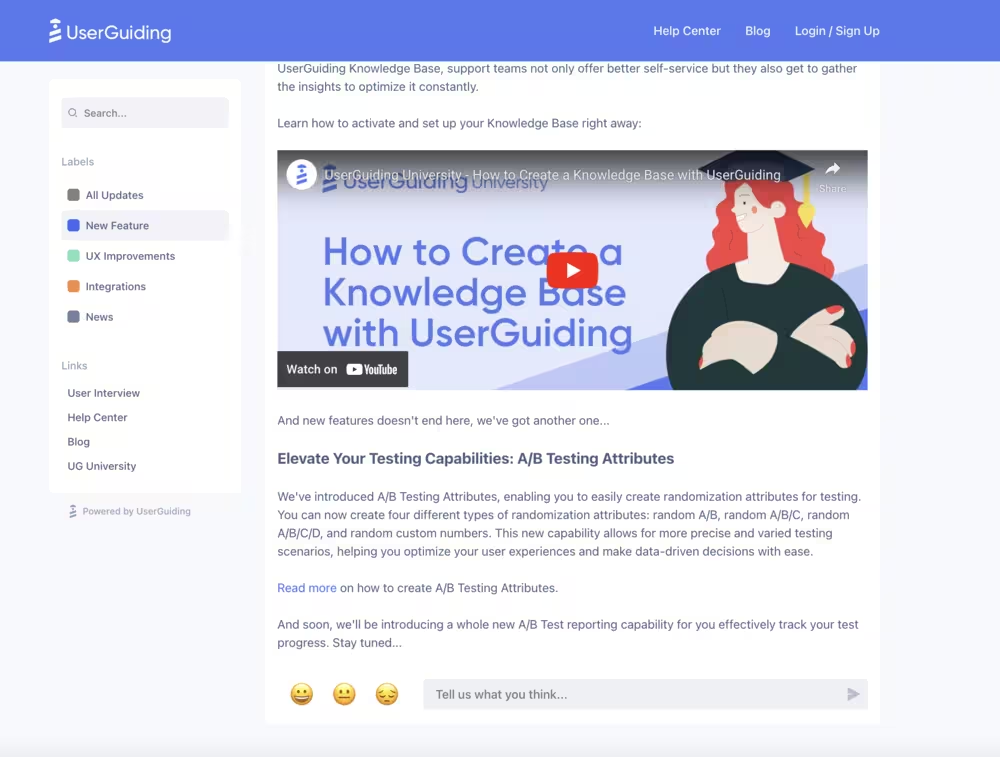
Although friction is a big part of it, users don’t just churn because of friction. They churn because they think nothing is evolving.
UserGuiding’s Product Updates feature combines changelogs with in-app promotion and two-way feedback. Every release can be:
- Announced via in-app modals
- Promoted inside the Resource Center
- Tagged and segmented
- Reacted to and commented on
It’s a great feature to encourage active engagement through your product’s evolution.
Why does that matter for retention? Because silent churn often starts with silent frustration.
When users can react, comment, and see ongoing product investment, they feel heard, and perception of growth strengthens loyalty.
The Resource Center
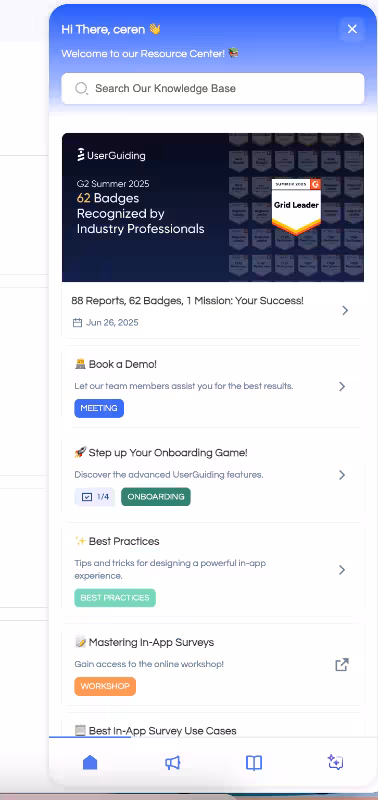
The Resource Center is where it all comes together: Knowledge Base, AI Assistant, Product Updates, Interactive guides.
One persistent, in-app hub.
Instead of scattering onboarding, support, and announcements across emails and external portals, everything lives inside the product — exactly where users need it.
Every time a user leaves your app to search for help, you create disengagement risk. The Resource Center eliminates that gap.
And the results are measurable: One UserGuiding customer reduced churn from 7% to 5% after implementing interactive tours.
Conclusion
In 2020, retention meant reducing churn. In 2026, retention means faster activation, deeper embedment, proactive engagement, and continuous expansion.
Anyone can build software now. But the winners are the ones who design systems that make leaving irrational.
Tools like UserGuiding make that shift easier: from counting repeat logins to expansion and continuous value delivered by your product.
Frequently Asked Questions
What is product-led retention and why does it matter in 2026?
Product-led retention is a growth strategy where the product itself drives long-term engagement, expansion, and renewals. In 2026 (with AI-native competitors, collapsing switching costs, and rising CAC), retention is the primary growth engine. Acquisition starts growth, but retention compounds it.
How is AI changing SaaS user retention strategies?
AI is shifting retention from reactive to predictive. SaaS companies now use AI-powered customer health scoring, churn prediction models, in-app assistants, and personalized onboarding to prevent churn before it happens. AI also raises user expectations, meaning slower, static products lose users quickly. In 2026, AI becomes the infrastructure itself.

.png)