.svg)
.svg)
.svg)
.svg)
.svg)


.svg)


.svg)
.svg)

You’ve probably heard that content is king—but let’s be real, if your website looks outdated or hard to use, most people won’t stick around long enough to read what you’ve got to say.
Here’s the proof:
👉 Around 94% of first impressions are based on design, and adding audio-visual elements can make visitors stay up to 88% longer.
Wild, right?
That’s why keeping up with what actually works—from layout choices to how fast your site loads—can save you a ton of time, effort, and money in the long run.
I’ve rounded up 130+ website statistics and trends for 2025, all in one place.
Whether you’re tweaking your design or trying to get more traffic, there’s something here you’ll want to know.
TL;DR
- Google Chrome held 66.64% of the European browser market in 2023. 🧭
- On mobile, Chrome also dominated globally with a 66% market share. 📱
- Publishing 16+ blog posts per month brings in 3.5x more traffic for company websites. ✍️
- There are over 600 million blogs on the internet right now. 🌐
- Around 252,000 new websites are launched every single day. 📈
- AI chatbot referrals to top news websites grew by over 2,100% in less than a year. 🧠
- 70% of users prefer blog posts over ads when researching a company. 📰
- Bounce rates between 26%–40% are considered healthy by SEO experts. 📉

Website Traffic Statistics
Understanding website traffic is key to measuring online visibility, marketing performance, and user behavior.
These stats reveal where visitors come from, how they navigate websites, and which sources drive the most engagement.
1- As explained by Search Engine Journal, when the bounce rate is between 26% and 40%, you are presumably good to go.
2- Publishing 16 blog posts per month instead of 4 or fewer makes company websites get 3.5x more visits.
3- There are currently over 600 million blogs on the internet.
4- Approximately 252,000 new websites are created each day, contributing to the ever-expanding digital landscape.
5- More than 3/4 of the internet's individual visitors read blogs frequently.
6- 70% of users prefer a blog post more than an ad when they want to get information about the company.
7- Between May 2024 and February 2025, traditional search engine referrals to the top 500 media and news websites in the U.S. decreased by over 15%, indicating a significant shift in how users access content online.
8- During the same period, referrals from AI chatbot platforms to these top 500 publishers increased by more than 2,100%, highlighting the growing influence of AI in directing web traffic.
9- About 73% of readers skim blog posts, highlighting the importance of clear headings and concise content.
10- There are about 1.12 billion websites worldwide, with only 17% (approximately 193.89 million) actively maintained.
11- Approximately 76% of bloggers create how-to articles, which are among the most effective content formats.
12- Blog posts averaging 1,427 words tend to perform better in terms of engagement and SEO.
13- Including at least one video in a blog post can result in 70% more organic traffic compared to posts without videos.
14- Bloggers who publish weekly or multiple times per month are more likely to report strong results.
15- Blog posts with images receive 94% more views compared to those without.
16- Regular blogging helps in achieving better SEO results, with businesses experiencing 55% more website visitors.
17- Companies that blog receive 97% more inbound links, which can improve domain authority and search rankings.
18- Websites with blogs have 434% more indexed pages, enhancing their visibility in search engine results.
19- Businesses that blog generate 67% more leads per month compared to those that don't.
20- Approximately 25% of UK shoppers have utilized AI tools for online shopping, with expectations that this will rise to one-third, indicating a move away from traditional search engines.
21- Retail traffic from AI sources experienced a tenfold increase between July and September 2024, suggesting a significant transformation in consumer behavior.
22- 61% of U.S. consumers rely on blog recommendations before making a purchase, showcasing the persuasive power of well-crafted content.
23- As of 2025, 80% of bloggers incorporate AI into their content creation process, with 54% using it for idea generation.
24- Blogging influences 6% of eCommerce sales, and this figure rises to 12% for businesses that blog regularly.
25- Content marketing, including blogging, costs 62% less than traditional marketing methods and generates approximately three times as many leads.
Website Visitor Statistics
Website visitor data sheds light on who’s actually landing on your site—what devices they use, where they’re located, how long they stay, and how often they return.
These statistics help tailor your content and user experience.
26- As of 2024, there are approximately 5.19 billion internet users worldwide, highlighting the vast audience available online.
27- The typical website visit lasts about 3 minutes and 45 seconds, indicating the average time users spend engaging with content.
28- Users view an average of seven pages during each website visit, suggesting a moderate level of engagement.
29- The average website receives approximately 375,773 unique visitors per month, though this number can vary widely based on industry and content.
30- If the images of a website take too long to load, 39% of people will stop engaging with it.
31- 2.6 seconds is the average time for a user's eyes to land on the most influential area of a website and generate a first impression.
32- As of 2023, Google leads with 131.2 billion monthly visits, followed by YouTube with 71.4 billion, and Facebook with 13 billion.
33- Over 83% of website visitors expect pages to load in three seconds or less; delays can lead to increased bounce rates.
Website Design Statistics
The visual and structural design of a website plays a critical role in user trust, navigation ease, and overall engagement.
These stats highlight how design choices directly impact user perception and interaction
34- Subtle animations and interactive elements, known as micro-interactions, are increasingly used to improve user experience and engagement.
35- Designing for voice search and commands is increasingly important as more users interact with websites using voice-enabled devices.
36- Dark mode designs are gaining traction, offering a sleek aesthetic and reducing eye strain for users.
37- In 2025, bold and oversized typography is a prominent trend- not to our surprise, it captures user attention and enhances readability.
38- 46.1% of web design agencies emphasize responsiveness as a major factor influencing web design costs.
39- While 80.7% of web design projects take around a month to complete, the average turnaround time is two months due to differences in site complexity.
40- The design of a website has an impact on the judgment of credibility by 70%.
41- If the content or the layout of a website is unattractive, 38% of people will stop interacting with it.
42- If users are given a time period of 15 minutes, 67% of them would prefer reading from a website with a good design rather than a plan page.
43- Users spend an average of 5.94 seconds looking at a website’s main image.
44- Users spend an average of 5.59 seconds looking at a website’s written content.
Website User Experience Statistics
User experience (UX) influences everything from time-on-site to conversion rates.
The following stats explore how elements like navigation, layout, accessibility, and responsiveness affect the way users interact with websites.
45- According to Contentsquare’s 2024 Benchmark Report, the average time spent per page is just 54 seconds—which makes us think of the need for fast, focused content delivery.
46- In the same report, the average bounce rate across industries stands at 49%, reinforcing the need for seamless, engaging UX.
47- Accessibility and ease-of-use are now top web design priorities for government and public-facing sites, according to the Granicus 2024 report.
48- The Digital Silk 2024 report notes that 88% of users won’t return after a bad website experience.
49- Websites with better user-centric design and intuitive navigation see 2x higher conversion rates.
50- 53% of users expect a webpage to load in under 3 seconds. Any longer, and most will leave.
51- Around 70% of users say they judge a company’s credibility based on its website design and experience.
52- 83% of consumers believe a seamless experience across all devices is crucial.
53- A 1-second delay in page load time can lead to a 123% increase in bounce rate, affecting user engagement.
54- Enhancing UX can lead to an 83% increase in conversion rates, underlining its impact on business success.
Website Browser Statistics
Different browsers handle websites in slightly different ways.
These statistics reveal browser usage trends across devices and regions, helping developers and designers optimize compatibility and performance.
55- In 2023, Google Chrome had 60.64% of the European market share while Safari had 20.06%, Microsoft Edge had 6.21%, and Mozilla Firefox had 5.18%.
56- In 2023, Google Chrome was the leader in the mobile internet browser market, with a share of 66%. Apple’s Safari had a market share of nearly 25%, Samsung Internet followed with almost 5% and Opera had 1.83% of the market share.
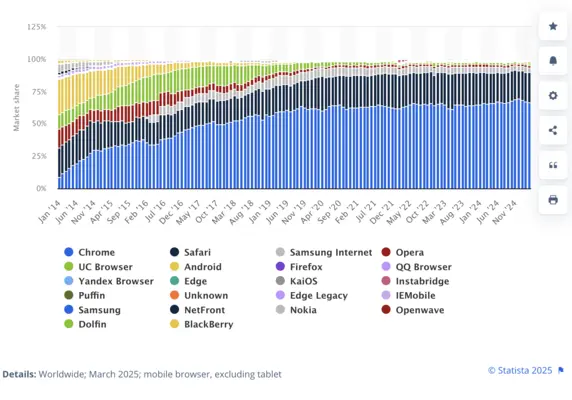
This chart illustrates the global market share of mobile internet browsers from January 2014 to March 2025.
Chrome dominates noticeably, followed by Safari, Samsung Internet, and Opera, showing how user preferences have evolved over time.
57- Google Chrome continues to lead the browser game globally in 2024, with a desktop market share of around 66.31%, followed by Microsoft Edge at 12.91% and Safari at 9.13%. Firefox holds on with 6.45%, while Opera sits at 2.79%.
58- When we narrow down to Europe, the most-used browser version is Chrome for Android, capturing 35.06% of the market. It's followed by Safari on iPhone with 15.31%, while newer versions of Chrome and Edge continue to grow in use.
59- The dominance of Chrome is particularly evident when looking at browser version breakdowns—Chrome 127 and 128 are some of the most-used versions in Europe and globally.
60- On the mobile side, Chrome remains dominant globally, holding roughly 66% of the market share as of early 2025. Safari trails behind at around 25%, followed by Samsung Internet at approximately 5% and Opera at just under 2%.
61- Interestingly, Safari takes the lead on tablets, holding around 33.4% of usage share, though Chrome still edges ahead with over 50% across all platforms.
62- Globally, as of late 2024, the market is still largely concentrated: Chrome holds about 65%, Safari sits at 18.35%, Edge follows with 5.19%, and Firefox, Samsung Internet, and Opera round out the rest with smaller but steady shares.
63- On the desktop front, Chrome is even stronger with a 65.14% share, while Edge sits at 13.06%, Safari at 8.78%, and Firefox at 6.89%.
Mobile Website Statistics
With mobile traffic dominating the web, mobile-first design is no longer optional.
These stats offer insight into mobile user behavior, expectations, and the growing impact of smartphones on website performance.
64- As of Q1 2024, 59.2% of global website traffic comes from mobile devices.
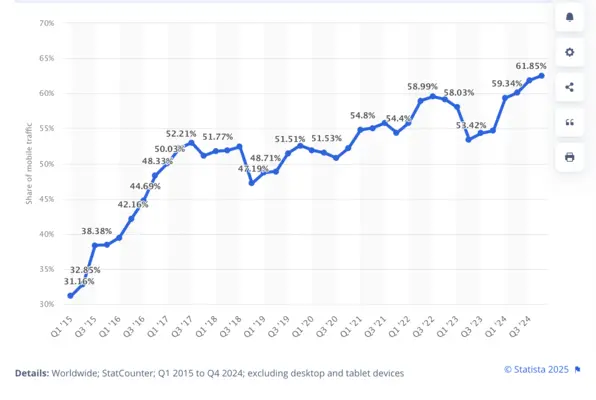
This line chart shows how the percentage of global website traffic coming from mobile devices has steadily increased from the first quarter of 2015 to the fourth quarter of 2024.
65- As of 2024, 54.4% of all website traffic worldwide originates from mobile devices, underlining the necessity for mobile-optimized websites.
66- In 2023, 59% of website traffic originated from mobile devices, emphasizing the importance of mobile optimization.
67- In December 2023, 83.64% of visits to Google.com were from mobile devices, underscoring the mobile-first behavior of users.
68- Mobile users are 5 times more likely to abandon a task if a site isn't mobile-optimized.
69- In 2017, 52.64% of the global organic search traffic source was mobile traffic.
70- Among users who search for a business on mobile, 88% either call or go to that business within 24 hours.
Website Engagement and Conversion Statistics
From click-through rates to form completions, engagement and conversion data reveals how well a website turns visitors into leads or customers.
These stats are essential for optimizing marketing funnels and UX.
71- Blog posts averaging between 2,000 to 3,000 words tend to achieve better conversion rates.
72- E-commerce sites generally convert between 1.84% and 3.71% of their visitors, while B2B websites tend to perform better—often seeing conversion rates between 2.35% and 4.31%.
73- Pages that feature video content tend to keep users engaged for about 6 minutes, whereas pages without video average just 4.3 minutes of viewing time.
74- 70% of consumers say page speed impacts their willingness to buy from an online retailer.
75- Overloading a webpage with too many design elements can cause a major drop in conversions—by up to 95%.
76- It takes just half a second for a visitor to decide what they think about your website.
77- 86% of people expect to find all the essential details about products or services directly on the homepage, without clicking around.
78- Nearly all initial impressions—around 94%—are shaped by how your website looks and feels.
Website Ranking Statistics
Ranking high on search engines is crucial for visibility and traffic.
These statistics dive into the factors that influence search rankings, from backlinks to page speed, and what separates top-ranking sites from the rest.
79- Google holds the top spot globally as the most visited website with over 175 billion monthly visits.
80- Google also leads in unique monthly visitors, attracting more than 9 billion unique users per month.
81- In the U.S., only 0.5% of websites receive over 10 million monthly visits, showing how concentrated high traffic is among top-ranked sites.
82- About 46% of U.S.-based websites have between 1,001 and 15,000 monthly visitors, reflecting a middle-tier rank.
83- 93% of all online experiences begin with a search engine, underlining the link between SEO and ranking potential.
84- The average bounce rate for websites in the top 10 of Google is under 50%, while lower-ranked sites often see bounce rates above 70%.
85- The top 3 Google results get over 50% of all clicks, making the top spots in SERPs highly competitive.
86- 75% of users never scroll past the first page of search results—making top rankings vital for visibility.
87- Long-form content (over 1,800 words) tends to rank higher in search engines, boosting visibility and SERP positions.
88- Websites that update content regularly have a significantly better chance of maintaining or improving rankings.
89- Just 4 out of 10 websites manage to appear on the first page of Google search results.
90- In 2023, businesses spent a massive $118.8 billion on local search ads alone.
91- Nearly half—48%—of the top websites in 10 major countries have chosen to block OpenAI’s web crawlers.
92- A whopping 96% of sites that land in Google’s top 10 results have earned backlinks from over 1,000 unique domains.
93- The top-ranking page on Google doesn’t just win clicks—it also gains 5% to 14.5% more do-follow backlinks from new referring sites.
International Website Statistics
As websites reach global audiences, understanding regional internet behavior becomes vital.
These stats highlight differences in traffic, design preferences, and user engagement across countries and cultures.
94- Google dominates Canada’s web space with over 171 million unique monthly visitors in 2022.
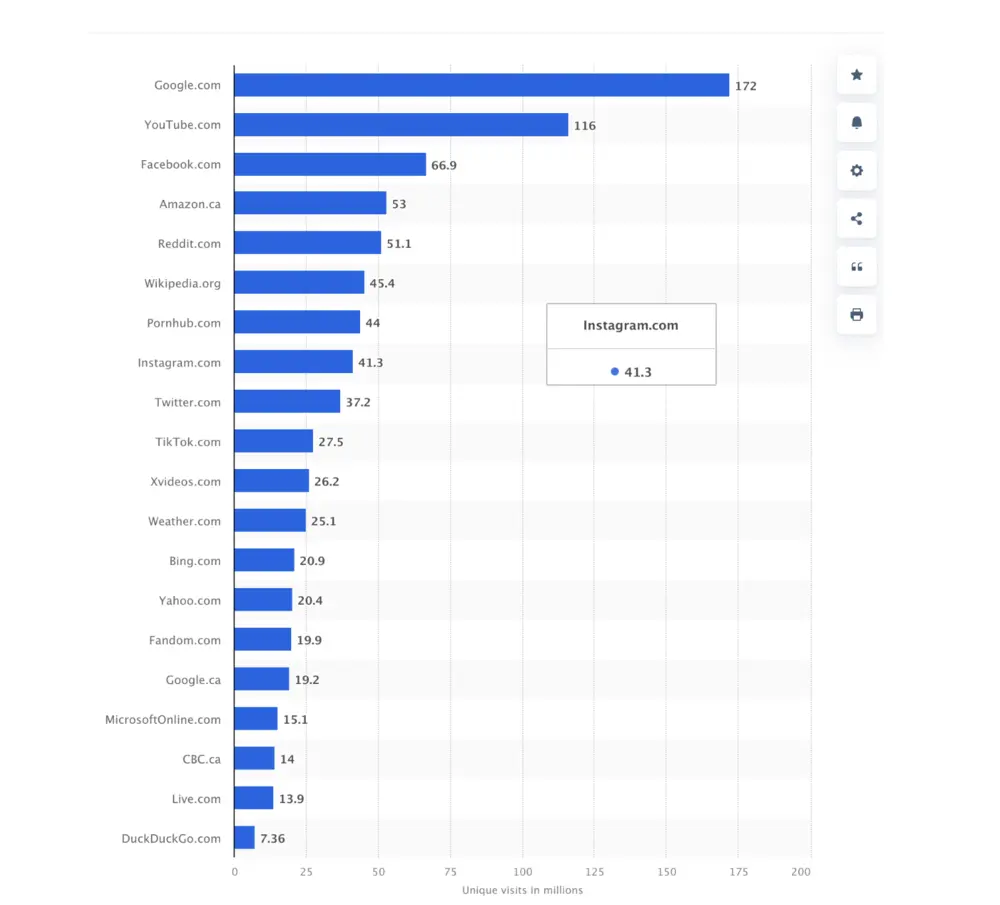
This bar chart lists Canada’s most visited websites by unique visitors from September to November 2023. Google, YouTube, and Facebook top the rankings.
95- In India, Google also holds the top spot with approximately 14.6 billion visits each month.
96- Baidu leads the web traffic in China, gathering 195.7 million visits per month.

This bar chart displays China’s leading websites by monthly visits. Baidu is the clear leader, followed by Bilibili and Tencent’s QQ.
97- South Korea’s most visited website is Naver, with around 23 million unique visitors monthly.
98- In Russia, Google saw over 2.8 billion visits in August 2023, while Yandex trailed behind with 1.7 billion.
99- Japan’s top-ranking website is Yahoo! Japan, pulling in massive traffic monthly.
100- VK, a Russian social network, consistently ranks among the top 10 most visited websites globally.
101- Facebook is among the most visited websites in countries like Brazil, Mexico, and the Philippines.
102- In Germany, Google and YouTube dominate the traffic charts, followed by Amazon and Facebook.
103- Despite its ban in China, Google maintains strong traffic numbers across most Asian countries, especially in Southeast Asia.
Website Performance and Speed Statistics
Speed isn’t just a luxury—it’s a necessity.
These stats show how loading times impact bounce rates, SEO rankings, and user satisfaction, and why performance optimization should be a top priority.
104- Businesses are losing around $2.6 billion every year simply because their websites load too slowly.
105- The global mean internet download speed increased from 24.8 Mbps in 2020 to 46.8 Mbps in 2023, improving website performance.
106- Over half of mobile users won’t stick around if a site takes more than 3 seconds to load—and just a 2-second lag can push bounce rates up to 87%.
1067- A study by Google found that as page load time goes from one second to seven seconds, the probability of a mobile site visitor bouncing increases by 113%.
108- 83% of people browsing the web expect sites to be fully loaded in three seconds or less.
109- The average mobile page load time is 1.9 seconds, while desktop pages load in 1.7 seconds.
110- The average page load time for websites globally is 1.9 seconds on mobile and 1.7 seconds on desktop.
111- Google.com sets the bar high with an average load time of just 0.77 seconds.
112- On average, the pages that make it to the first page of Google load in about 1.65 seconds.
113- Only 15% of websites have acceptable loading times, with nearly half taking 6 to 10 seconds to load—double Google's recommended speed.
114- 46% of websites have load times between 6 and 10 seconds, far exceeding Google's recommended load time.
115- The average server response time for top-performing websites is under 312 milliseconds.
116- Websites on the first page of Google have an average load time of 1.65 seconds, indicating the importance of speed for SEO.
117- A 0.1-second improvement in load time can lead to an 8.4% increase in conversions for retail websites.
118- 53% of mobile users abandon a site if it takes more than 3 seconds to load.
119- Larger websites tend to have faster load times, with Top 1000 websites averaging 1.1 seconds on mobile, compared to 1.4 seconds for sites ranked in the Top 10 million.
120- Page load times in countries like Nigeria and Angola average over 4.7 seconds, highlighting global disparities in web performance.
121- Websites that load in under 2 seconds are considered fast by 47% of users, emphasizing the need for speed.
122- 40% of users abandon websites that take more than 3 seconds to load, underscoring the importance of fast load times.
123- Websites with fast load times experience lower bounce rates and higher engagement.
124- Websites that pass Core Web Vitals assessments have seen a 6% increase in performance in 2023.
125- Prerendering pages can improve load times by 500-700 milliseconds, enhancing user experience.
126- Tab throttling in browsers has led to improvements in load times by reducing background tab activity.
127- Optimizing server response times has been a focus in recent browser updates to improve load times.
128- Reducing JavaScript and CSS delivery times has contributed to faster page loads in recent web performance improvements.
129- Optimizing image delivery has been a key strategy in reducing load times and improving user experience.
130- 70% of shoppers report that a website's load time significantly influences their purchasing choices.
131- A one-second delay in website loading can result in an 11% decrease in the number of page views.
132- Websites that load within one second could potentially generate 30.5 sales for every 1,000 visitors.
133- If a website takes 5 seconds or longer to load, the number of sales drops to an estimated 10.8 per 1,000 visitors.
134- Retail businesses lose a total of $2.6 billion annually due to slow website loading times and resulting lost sales.
135- Improving the Largest Contentful Paint (LCP) by 31% can lead to an 8% increase in sales for a website.
136- 18.7% of visitors to B2B manufacturing websites experience frustration due to slow page load times.
137- Website speed is one of the top 20 ranking factors that Google uses to determine search rankings.
138- Sweden boasts the fastest websites in Europe, with an average page load time of just 3.74 seconds.
139- Finland follows closely behind, with websites loading in an average time of 3.84 seconds.
140- Denmark and Latvia share third place with websites that take 4 seconds to load on average.
Most Popular Websites

The most visited websites globally reveal trends in user interest, behavior, and platform dominance.
These stats offer a glimpse into the digital giants shaping how we consume content and interact online.
Search Engines
- Google.com remains the most visited website globally, receiving over 85 billion monthly visits. and
- Bing.com and Baidu.com follow as secondary players, with Baidu leading the Chinese market.
Social Media & Messaging
- Facebook.com receives more than 17 billion monthly visits, maintaining its status as the most visited social platform.
- Instagram and X.com (formerly Twitter) also rank in the top 10 globally, with Instagram seeing over 6 billion visits monthly.
- WhatsApp.com attracts over 3 billion monthly visits.
- Reddit.com receives approximately 2 billion monthly visits.
Video Streaming Platform
- YouTube.com is the second most visited website in the world, with over 33 billion monthly visits.
- TikTok.com continues rapid growth, exceeding 2 billion monthly visits.
- Twitch.tv ranks among the top streaming services, especially in the gaming vertical.
E-commerce
- Amazon.com leads in global online shopping traffic, with more than 2.4 billion monthly visits.
- eBay.com consistently ranks among the top 50 websites worldwide, driven by both consumer and business sellers.
Information & Knowledge
- Wikipedia.org attracts nearly 5 billion visits per month.
- Yahoo.com, despite a decline in popularity, still receives significant traffic with over 2 billion monthly visits.
Technology & Software
- Microsoft.com and Apple.com each receive over 1 billion monthly visits, reflecting the continued dominance of their software and hardware ecosystems.
Conclusion
Whether you’re deep in analytics or just dipping your toes into website strategy, these stats reveal one big truth: every click, scroll, and second counts.
From traffic trends to browser habits and bounce rates, the numbers tell a powerful story about what people expect from a website.
Hopefully, these insights help you build smoother, faster, and more engaging digital experiences—because in the end, the best websites are the ones people actually want to stay on. 🚀
Frequently Asked Questions
What is a website and an example?
A website is a collection of related web pages under a single domain name, accessible via the internet.
For example, www.wikipedia.org is a website offering a vast online encyclopedia.
What is the website address?
A website address, or URL, is the unique location used to access a website on the internet—like www.example.com.
What is a web page vs. website?
A webpage is a single document or page on the internet, while a website is a group of interconnected webpages under one domain.
What are the most important website statistics to track for conversion rate optimization?
Key stats include bounce rate, average session duration, click-through rate (CTR), conversion rate, exit rate, and user flow through key pages.
Which website trends in 2025 are driving higher engagement and lower bounce rates?
In 2025, fast-loading pages, interactive visuals, mobile-first designs, and personalized content are significantly boosting engagement and reducing bounce rates.

.png)